
Technical and graphical analysis

This e-learning course 'Technical and graphical analysis' supports you in mastering this topic in a professional context.
The aim of this course is to help you understand the strategic role of graphical analysis.
The examples, situational exercises, and case studies are designed to be easily transferable to different professional contexts and types of organizations.
Prerequisites
No specific prerequisites are required to follow this course.
Target Audience
Managers, HR managers and employees concerned with the topic 'Technical and graphical analysis'.
Content
The course is structured into several complementary modules, combining theoretical contributions, practical applications, and interactive activities to facilitate the appropriation of concepts.
Training path
 Why technical analysis is essential for performanceAre you looking to anticipate financial markets with greater precision? Do you want to better understand price behaviors to improve your buying or selling…
Are you looking to anticipate financial markets with greater precision? Do you want to better understand price behaviors to improve your buying or selling decisions? This module is for you.
What you will discover:
In this introductory module, you will understand why technical analysis is now essential to any financial evaluation process. With a clear and business-oriented approach:
- You will become aware of the strategic value of analyzing stock charts
- You will discover how technical analysis complements fundamental analysis
- You will identify the main issues related to reading market signals
Why take this module?
- Available now in a standalone version, this module is aimed at anyone who wants to gain a first mastery of technical analysis, whether you are a beginner or a future market professional.
- It also serves as the strategic entry point of the overall e-learning path “Finance, Management Control & Purchasing,” with a strong focus on graphical analysis and associated decision-making tools.
- By taking this module, you lay the essential foundations for a rapid, structured, and operational skill enhancement in the world of trading, analysis, and financial asset management.
Is this module right for you?
Ideal for:
- Analysts looking to strengthen their market reading skills
- Students in finance, trading, or management control
- Purchasing professionals eager to follow price trends
Get ahead of the market by understanding what others ignore.
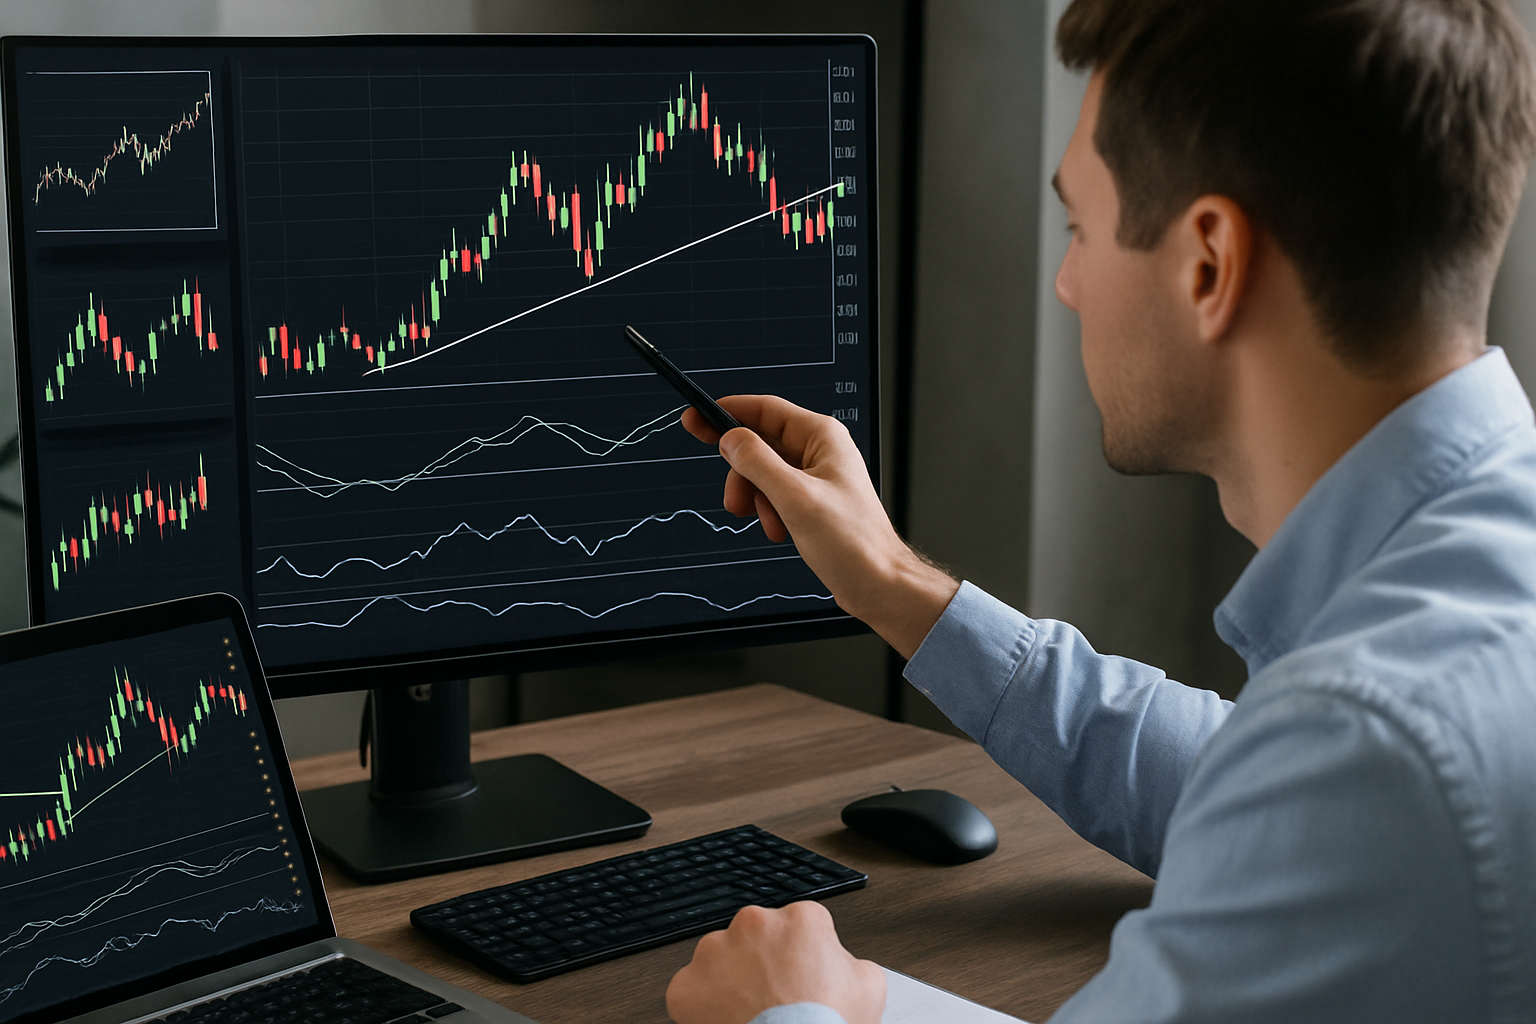 Graphical analysis techniques for effective decision-makingDecipher the movements of financial markets with method and precisionThis 100% online e-learning module immerses you in the exciting world of technical and graphical…
Decipher the movements of financial markets with method and precision
This 100% online e-learning module immerses you in the exciting world of technical and graphical analysis, essential for any informed decision-making on the financial markets. Whether you are a student, aspiring analyst, or already active in trading, this module will provide you with a solid foundation to understand and anticipate market reactions.
What is the purpose of this module?
It answers an essential question: How do you interpret a stock chart?
Thanks to a clear and structured approach, you will be able to visually identify the most common chart patterns, recognize trend reversal signals, and detect key support and resistance levels.
Why choose this module?
✔ Learn at your own pace with 100% digital learning
✔ Accessible independently or integrated into a complete "Finance, Management Control & Buying »
✔ Ideal for making informed buy or sell decisions using proven technical indicators
You will learn, in particular, to:
• Read and compare the three main types of charts: line charts, Japanese candlestick charts, and bar charts
• Recognize major market trends: bullish, bearish, or neutral
• Detect support and resistance levels that influence buying and selling behavior
• Understand key technical indicators: moving averages, RSI, MACD
• Begin independently analyzing the dynamics of price fluctuations
This practical introduction effectively prepares you for the subsequent modules of the course, especially the immersive simulator in Module 5, where you will apply your skills to real, simulated market situations.
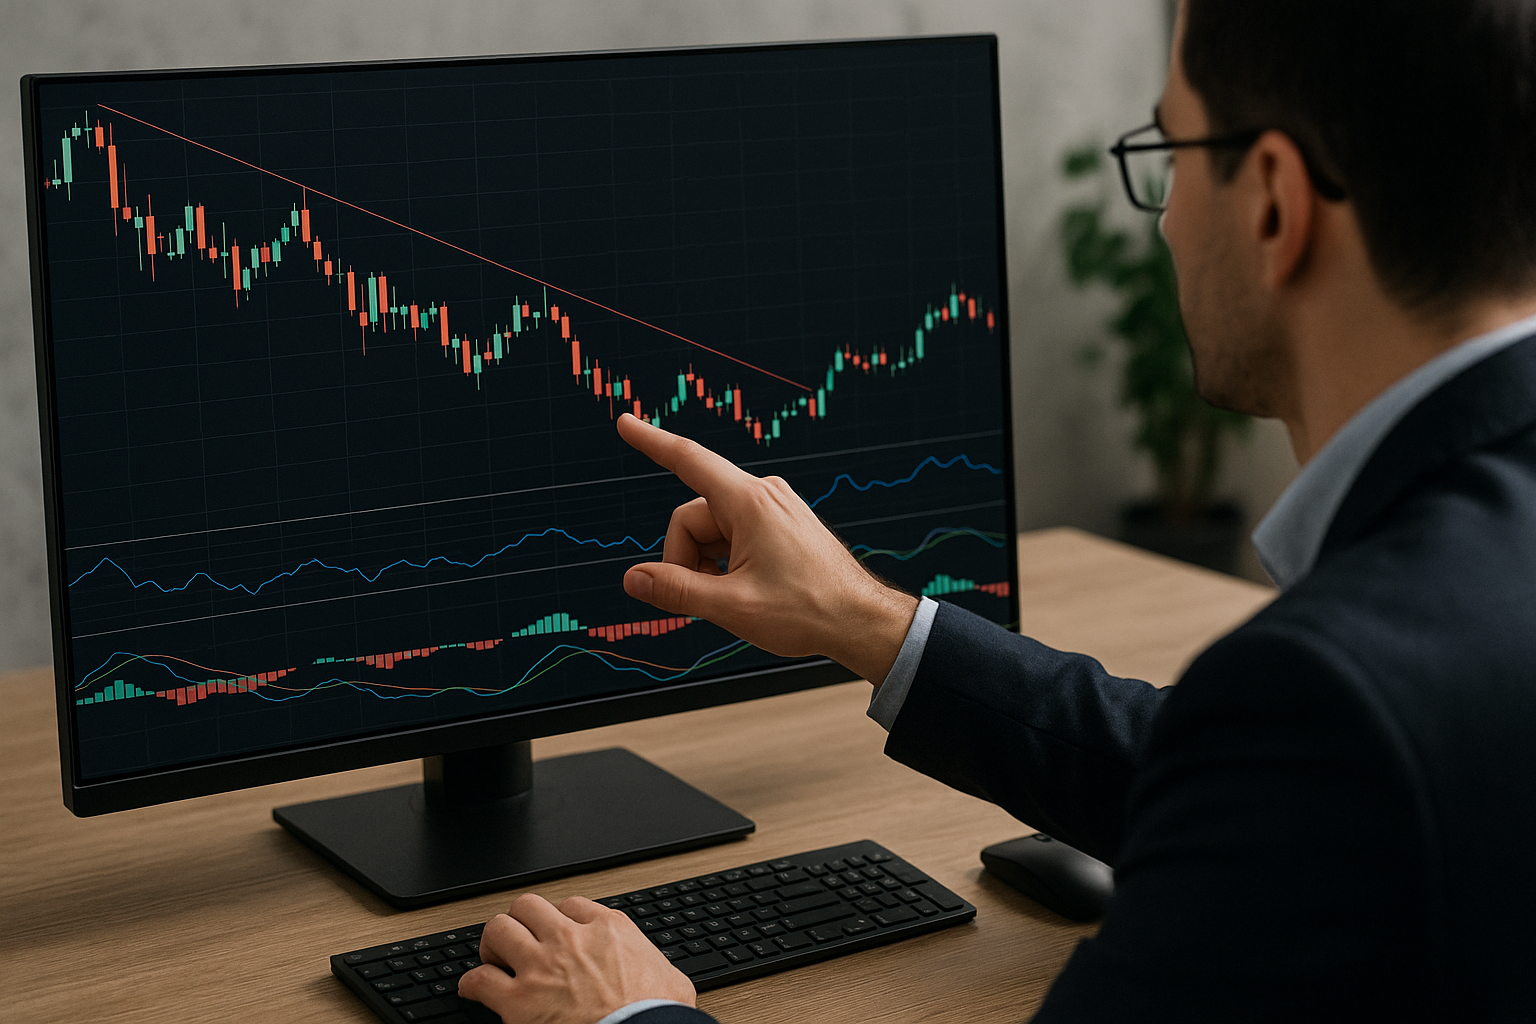 Graphical analysis techniques for decision-makingMaster the essentials of technical analysis to optimize your financial decisions.Do you want to act precisely in the markets by identifying the right times…
Master the essentials of technical analysis to optimize your financial decisions.
Do you want to act precisely in the markets by identifying the right times to buy or sell?
This module provides you with the essential techniques of technical analysis, used by professionals in finance, management control, and procurement to anticipate market movements.Who is this module for?
- Financial analysts wishing to refine their technical interpretations
- Trading students eager to quickly develop their skills
- Anyone involved in market trend analysis
What you will learn:
- Quickly detect trends using the most reliable technical methods
- Identify buy and sell signals using the right technical indicators
- Avoid the most frequent interpretation errors through examples and case studies
- Structure your technical analysis with practical and operational frameworks
- Strengthen your analytical reflexes through to an active and immersive teaching approach
👉 This module can be taken independently or integrated into the complete "Finance, Management Control & Purchasing" program, for a 360° analytical view adapted to real-world challenges.
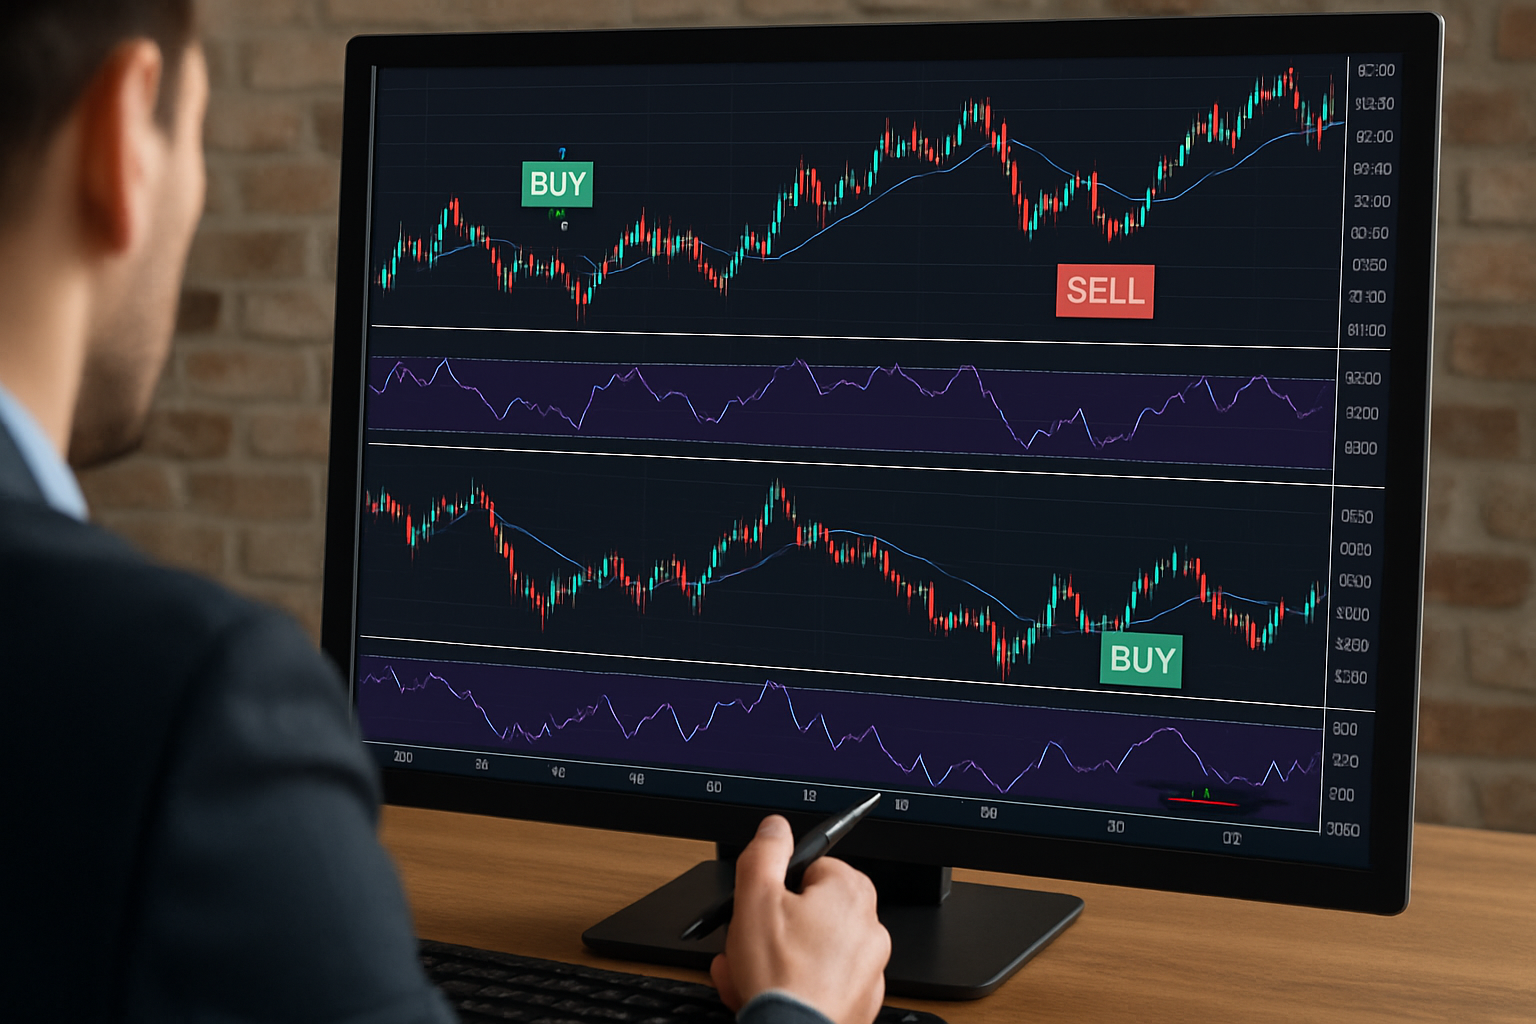 Graphical Analysis for Innovation and Development StrategiesRefine your decisions through expert reading of stock charts.Mastering technical analysis is not just about recognizing patterns: it is the art of adapting your…
Refine your decisions through expert reading of stock charts.
Mastering technical analysis is not just about recognizing patterns: it is the art of adapting your diagnosis to the real market conditions. This immersive module places you in front of three complex and dynamic situations, putting you in the shoes of an analyst tasked with anticipating price fluctuations.
What you will experience:
• Realistic scenarios designed to simulate the behaviors of financial markets
• Assisted reading of technical indicators (moving averages, RSI, MACD…) to refine your judgment
• Strategy adjustments based on market profile: bullish, bearish, or sideways
• Guided evaluations to anchor best practices
Who is this module for?
This e-learning module is aimed at analysts, trading students, or finance professionals who wish to go beyond theory to develop a tactical sense in their analyses.
An autonomous or integrated learning experience
You can follow this module independently for targeted training or integrate it into our complete path “Finance, Management Control & Purchasing”, as a key step to mastering technical analysis in a strategic context.
Why choose this module?
• To know what to do in the face of an uncertain market configuration
• To accurately assess when to buy, strengthen, or sell
• To build a structured visual reasoning, based on objective indicators
Unlock your observational potential and make more relevant chartist decisions.
 Master quiz - Technical and Graphical AnalysisAn interactive and engaging quiz to test your stock market skillsDive into a fun and stimulating challenge inspired by the best game shows, where…
An interactive and engaging quiz to test your stock market skills
Dive into a fun and stimulating challenge inspired by the best game shows, where each correct answer brings you closer to victory!
This module can be taken independently or integrated into the complete e-learning path dedicated to “Finance, Management Control & Purchasing,” to enhance your skills in financial market analysis.
Game Concept:
You will face 15 questions of increasing difficulty on technical analysis and reading stock charts. The goal? Accumulate correct answers to reach the top of the leaderboard.
Like in a well-known TV game, each stage increases in intensity and tests your mastery of the fundamentals and subtleties of graphical analysis in finance.
You have 3 lifelines to assist you:
- 50/50: two incorrect answers are eliminated.
- Expert opinion: receive a brief analysis to guide you.
- Change question: move to a new question without penalty.
3 safety levels mark your progress:
- Level 1 – Validated at the 5th correct answer: you have secured the essentials.
- Level 2 – Validated at the 10th correct answer: you confirm your expertise.
- Level 3 – Victory at the 15th correct answer: you master graphical analysis!
Why is this module essential?
- It allows you to review and consolidate your knowledge in an engaging way.
- It is aimed at both passionate beginners in the stock market and aspiring analysts.
- It strengthens your key skills to identify reliable technical signals in investment situations.
- It serves as a perfect step for validation or preparation for real-life situations, especially thanks to the simulator present in the overall path.
A short, impactful, and effective format, ideal for modern or mobile learning. Take advantage of this self-assessment tool to identify your areas for improvement and enhance your performance in graphical reading.