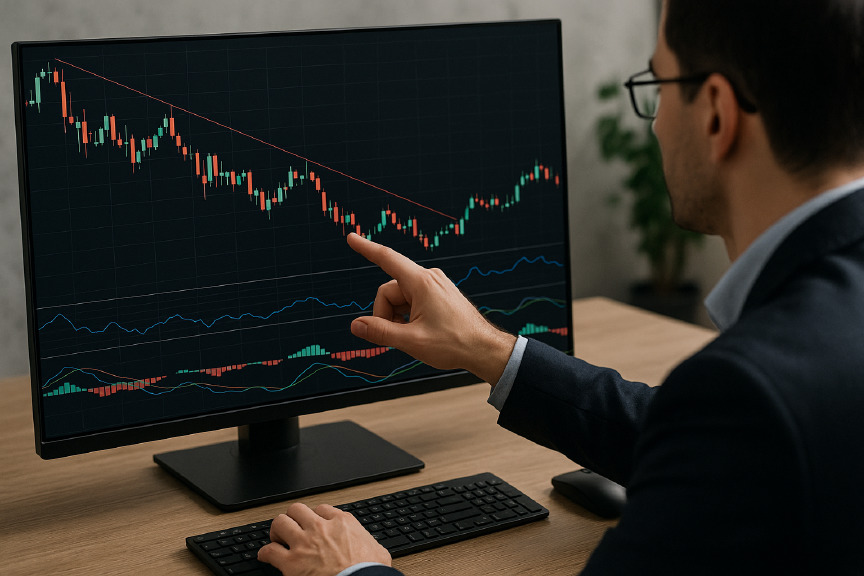
Key Techniques of Chart Analysis
Master the essentials of chart analysis to optimize your financial decisions.
Do you want to act precisely on the markets by identifying the right times to buy or sell? This module provides you with the essential techniques of graphical analysis, used by professionals in finance, management control, and Procurement to anticipate market movements.
Who is this module for?
- Financial analysts wishing to refine their graphical interpretations
- Trading students wishing to quickly improve their skills
- Anyone involved in analyzing market trends
What you will learn:
- Quickly detect trends using the most reliable graphical methods
- Identify buy and sell signals using the right technical indicators
- Avoid the most common interpretation errors through examples and scenarios
- Structure your technical analysis with practical and operational reading grids
- Strengthen your reflexes analyst thanks to active and immersive teaching
This module can be taken independently or integrated into the complete “Finance, Management Control & Procurement” course, for a 360° analytical vision adapted to field challenges.


